Protein-rich foods: the ranking no one publishes
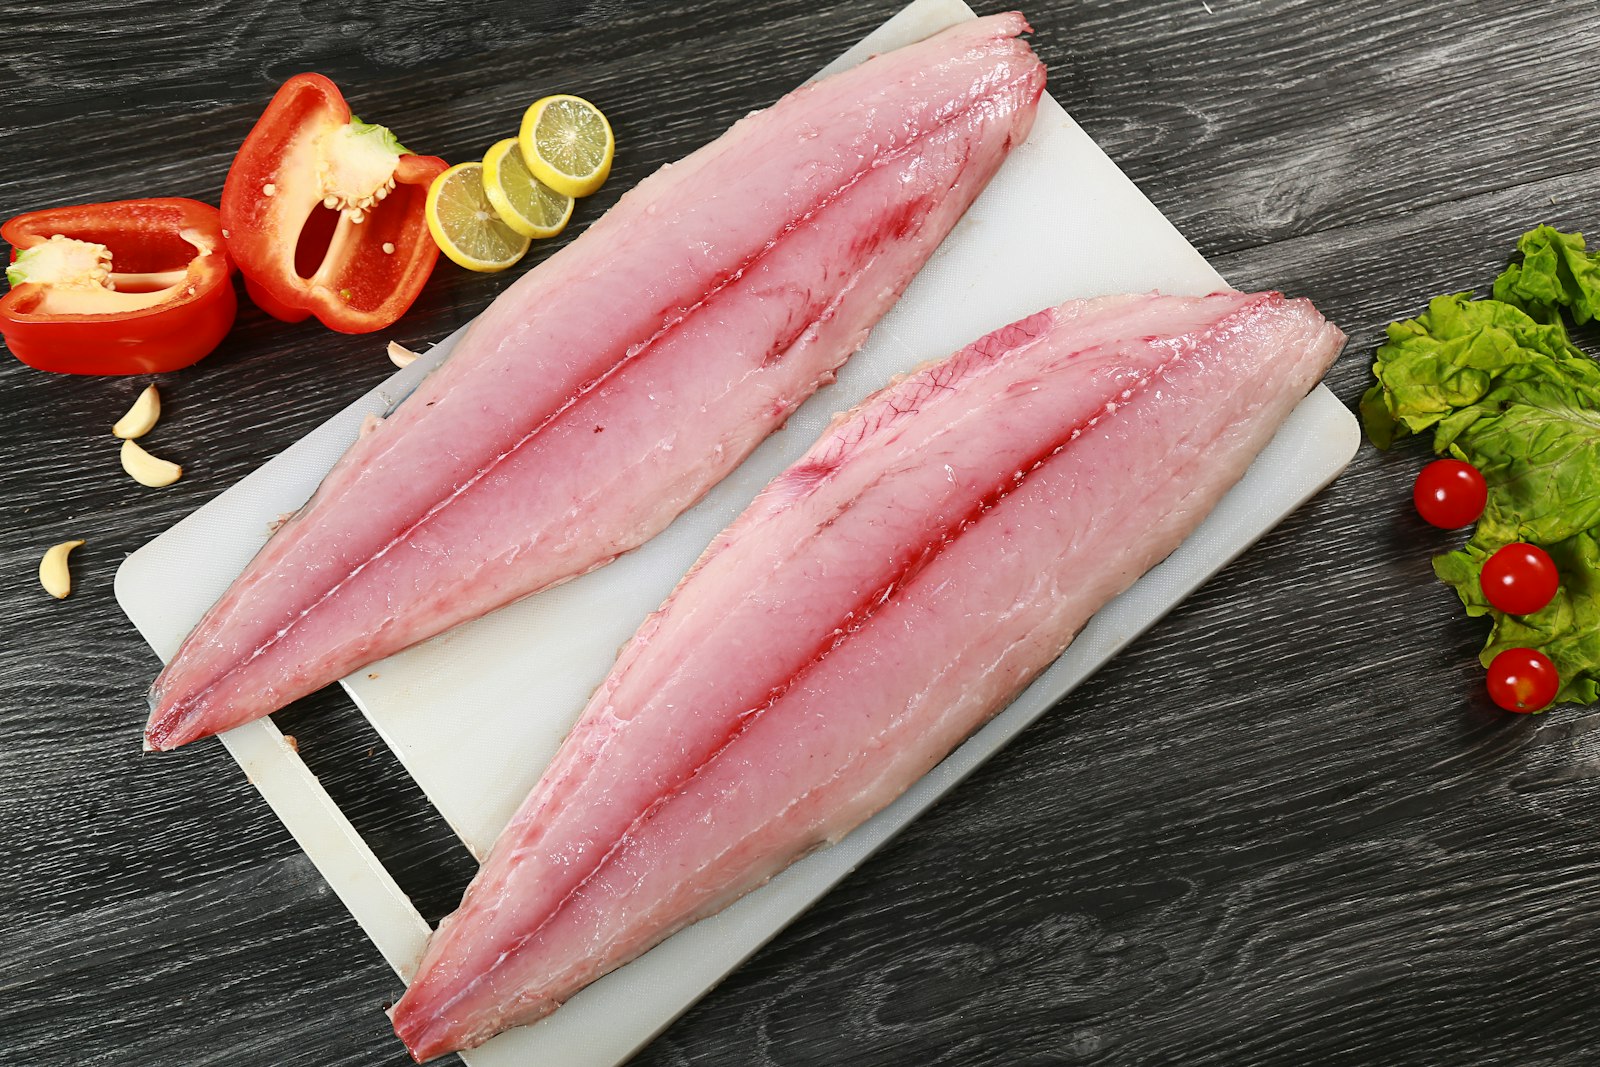
Type "high-protein foods" and you will come across the same ranking everywhere: gelatin, powdered egg white, yeast. Foods that no one eats by the spoonful. The problem is not the data — it is accurate — it is the ranking: sorting by protein per 100 g makes anything that has been dried win. Here is the same work done differently, based on the 2,298 foods from the CIQUAL table present in our database.
The ranking everyone publishes
If you simply sort by protein content per 100 g, here is what comes out on top of the French table:
| Food | Protein / 100 g |
|---|---|
| Gelatin, dry | 86.9 g |
| Egg white, powdered | 81.2 g |
| Whole egg, powdered | 47.9 g |
| Salted cod, dry | 47.6 g |
| Nutritional yeast | 40.4 g |
Five foods, and five dehydrated products. The common point is obvious once you see it: the water has been removed. A dry cod shows 47.6 g because almost only the protein remains; soaked again, it goes back down to the level of any white fish. This ranking says nothing about what we put on our plate.
The metric that actually matters: protein per calorie
The real question, when trying to eat more protein, is almost never "how much per 100 g". It is: how much protein do I get for the calories I spend eating it? A hard cheese and a cod fillet contain about as much protein by weight. They have nothing to do with each other as soon as you count calories.
Calculation based on the CIQUAL table (ANSES)
Le cas de l'emmental
Le vrai classement, aliment par aliment
Voici les aliments courants, triés par densité protéique. La dernière colonne est celle qui compte : c'est la quantité de protéines que 100 kcal de cet aliment vous rapportent.
| Aliment (forme consommée) | Prot. / 100 g | kcal / 100 g | Prot. / 100 kcal |
|---|---|---|---|
| Thon au naturel, égoutté | 26,8 g | 111 | 24,1 g |
| Cabillaud, cuit | 23,1 g | 99 | 23,4 g |
| Escalope de dinde, poêlée | 28,5 g | 124 | 23,0 g |
| Blanc de poulet, poêlé | 30,1 g | 141 | 21,3 g |
| Crevette, cuite | 19.0 g | 94 | 20.3 g |
| Sliced turkey breast | 20.9 g | 104 | 20.1 g |
| Cured ham, rindless defatted | 20.3 g | 119 | 17.1 g |
| Ground beef 5% fat, cooked | 25.5 g | 155 | 16.5 g |
| Fromage blanc 0% | 7.95 g | 49 | 16.1 g |
| Mussels, cooked | 17.2 g | 108 | 15.9 g |
| Pork tenderloin, cooked | 26.1 g | 168 | 15.5 g |
| Beef flank steak, grilled | 25.0 g | 162 | 15.4 g |
| Plain yogurt 0% | 4.82 g | 39 | 12.2 g |
| Salmon, cooked | 23.0 g | 205 | 11.2 g |
| Fromage blanc 3% | 8.03 g | 77 | 10.4 g |
| Hard-boiled egg | 13.5 g | 134 | 10.1 g |
| Minced steak 15% fat, cooked | 23.6 g | 239 | 9.9 g |
| Parmesan | 31.1 g | 406 | 7.7 g |
| Emmental | 27.9 g | 373 | 7.5 g |
| Mozzarella (cow's milk) | 16.5 g | 227 | 7.3 g |
Three surprises in this table
Chicken breast is not in first place. It remains excellent, but canned tuna in water, cod and even turkey escalope do better for equal calories. Chicken owes its reputation to its raw content — 30.1 g per 100 g once pan-fried, which is indeed at the top of the range for meats.
Not all fish are equal. Cod provides 23.4 g per 100 kcal, salmon 11.2: twice the difference for two fish. The difference is not the protein (23.1 versus 23.0 g per 100 g, practically identical) but the fat, which makes salmon go from 99 to 205 kcal. This does not make salmon less interesting — its lipids are precisely what you look for in it — but makes it a poor choice if the goal is protein at the lowest caloric cost.
5% or 15%, it's no small detail
And without meat or fish?
Plant sources clearly lose on this metric, and it is better to know it than to discover it along the way:
| Food | Prot. / 100 g | kcal / 100 g | Prot. / 100 kcal |
|---|---|---|---|
| Seitan | 20.6 g | 134 | 15.4 g |
| Textured soy protein, rehydrated | 18.6 g | 150 | 12.4 g |
| Tempeh | 16.1 g | 157 | 10.3 g |
| Plain tofu | 13.4 g | 148 | 9.1 g |
| Kidney bean, cooked | 9.63 g | 116 | 8.3 g |
| Green lentil, cooked | 10.1 g | 127 | 8.0 g |
| Chickpea, cooked | 8.31 g | 147 | 5.7 g |
| Oat flakes (dry) | 13.3 g | 367 | 3.6 g |
| Wholegrain bread | 8.38 g | 244 | 3.4 g |
| Quinoa, cooked | 4.66 g | 149 | 3.1 g |
Seitan is the only one that holds its own compared to meat, and even then: it is on par with a 5% fat minced steak, not a white fish. Legumes hover around 8 g per 100 kcal, which is three times less than cod — not because they are low in protein, but because they provide a lot of starch at the same time. A vegetarian meal aiming for the same protein total will therefore mechanically be more caloric, or larger in volume.
Quinoa is not a protein source
How much do you actually need?
This ranking is useless as long as we don't know what target to aim for. The meta-analysis we talk about in whey or natural proteins looked for the point where gains stop: beyond about 1.62 g of protein per kilo and per day, adding more produced no further lean mass gains. For 75 kg, that comes to about 120 g per day.
Translated with the table above: 120 g of protein is about 450 g of cooked cod — for 450 kcal. The same total in Emmental would require 430 g of cheese and 1,600 kcal. That is the whole usefulness of the right-hand column.
All the figures in this article come from the food diary's food database. You can find each of them there, and see where you actually stand over the day rather than estimating it.
Count my proteinThis article is not based on any clinical study, and that is normal: the protein content of a food is a laboratory measurement, not a trial result. All figures come from ANSES's CIQUAL composition table, as imported into our food database, and the "protein per 100 kcal" column is a simple calculation based on the other two. The values retained are those of the food as eaten — cooked when the table distinguishes raw from cooked. A composition table gives averages: a specific piece, a longer or shorter cooking time, or a particular brand will deviate from them. Informative content, which does not replace the advice of a professional.